
The advent of Vision Pro sparked the idea to create an app to save and visualize information and connections between people and events. Vision Pro would be able to show a large amount of data surrounding the viewer aiding in the identification of previously unknown pathways between nodes. This helps me with historical research essentially extending my memory to recall small bits of events that my memory would have otherwise discarded. It might also be useful in law enforcement by aiding in connecting subjects of interest.
The app is using Mac Catalyst, CloudKit, and ARKit sot hat it can be used on the Mac, iPhone and Vision Pro. I did find the limits of ARKit however and will likely move the macOS version to SceneKit and Vision Pro to using UIView instead of drawing 3D objects.
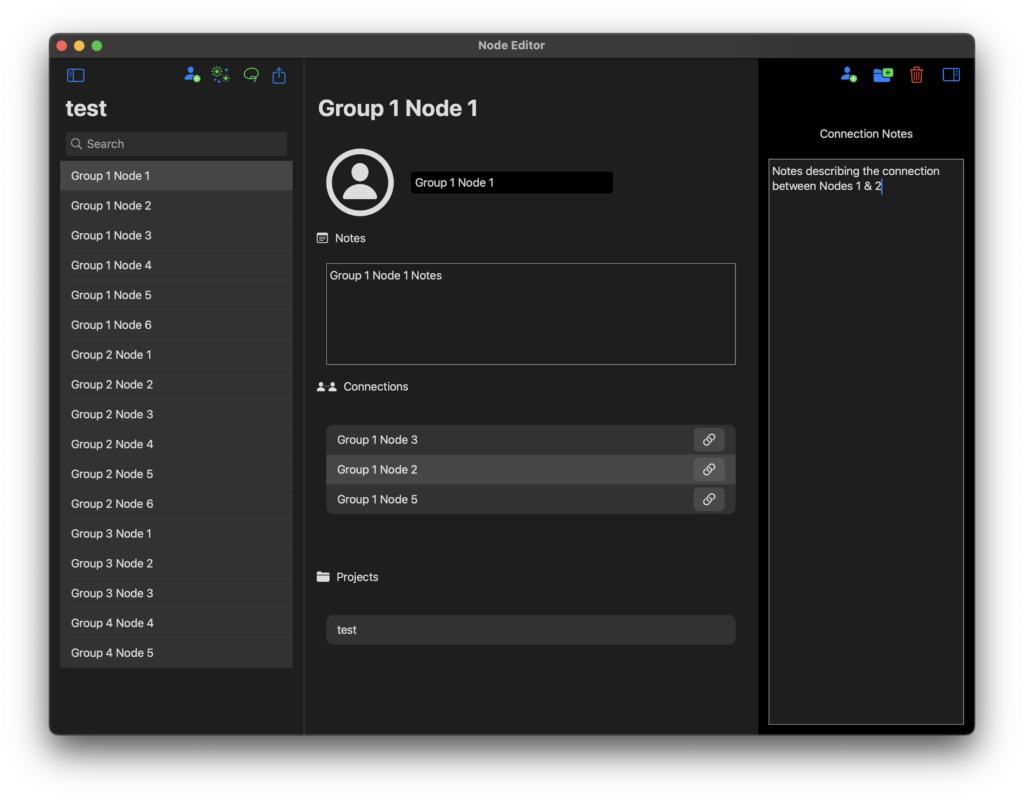
Adding a Node
This is how a node is added. I called this one Group 1 Node 1 but it could just as easily be called Abraham Lincoln. You can see it has a connection to Group 1 Node 2.
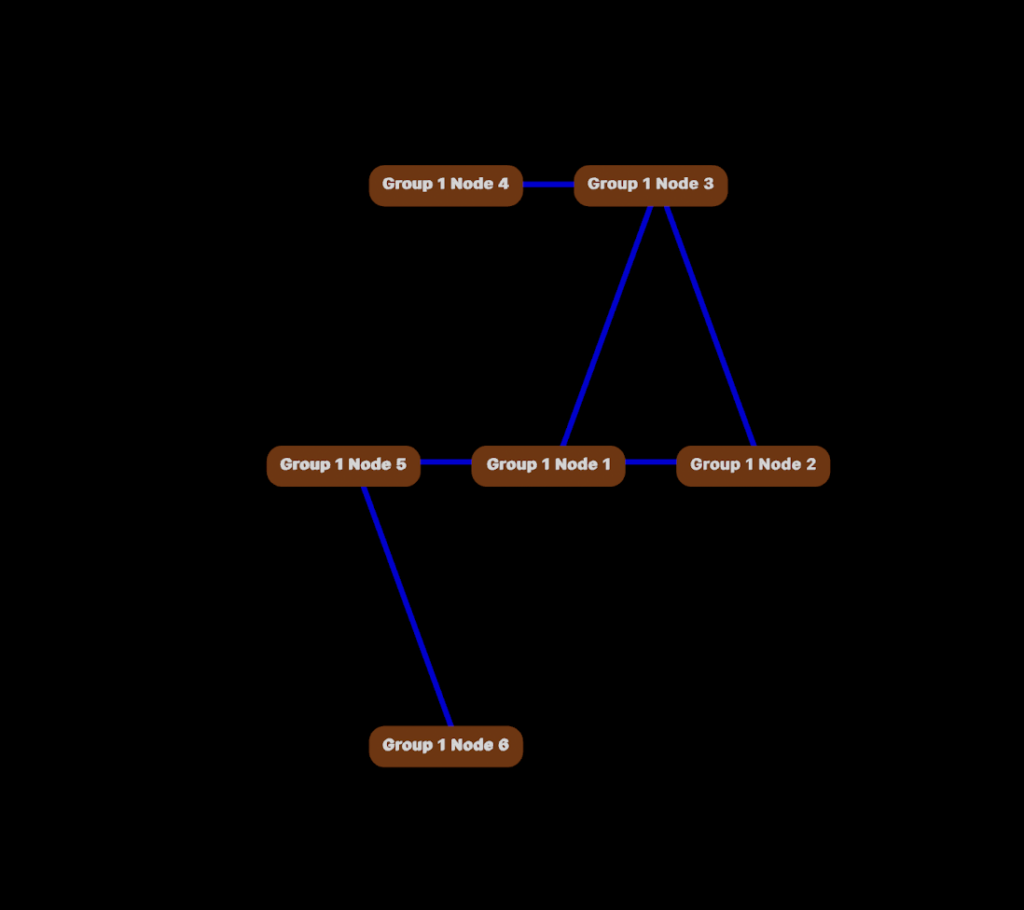
Visualizing Node Connections
Now let’s see what the connection will look like in the 3D viewer.
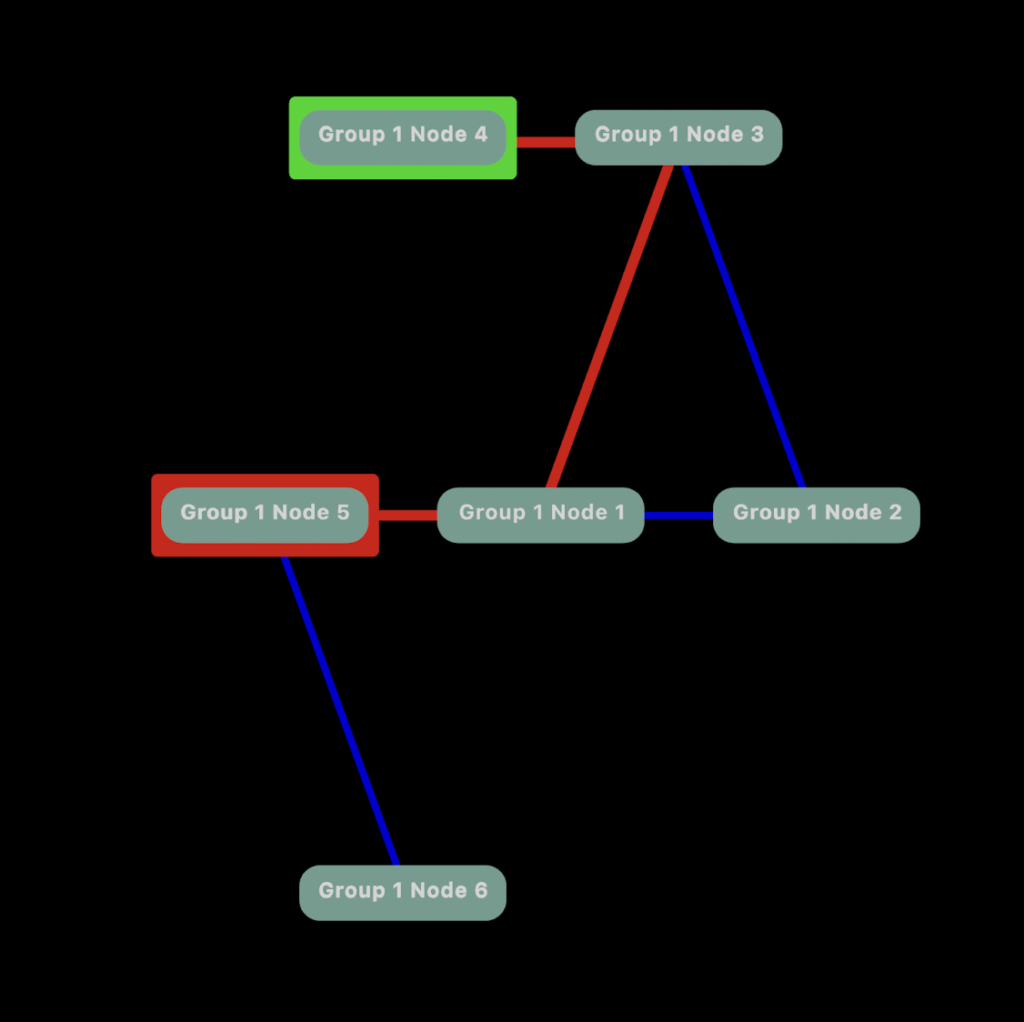
Finding the Paths Between Nodes
Nothing too fancy so far. We can make it more interesting by applying a little graph theory. How about if we want to show a pathway between Node 4 and 5. Let’s apply Dijkstra’s Algorithm for finding the shortest path between nodes.
Maybe we want to see a heat map highlighting connections for Node 5.
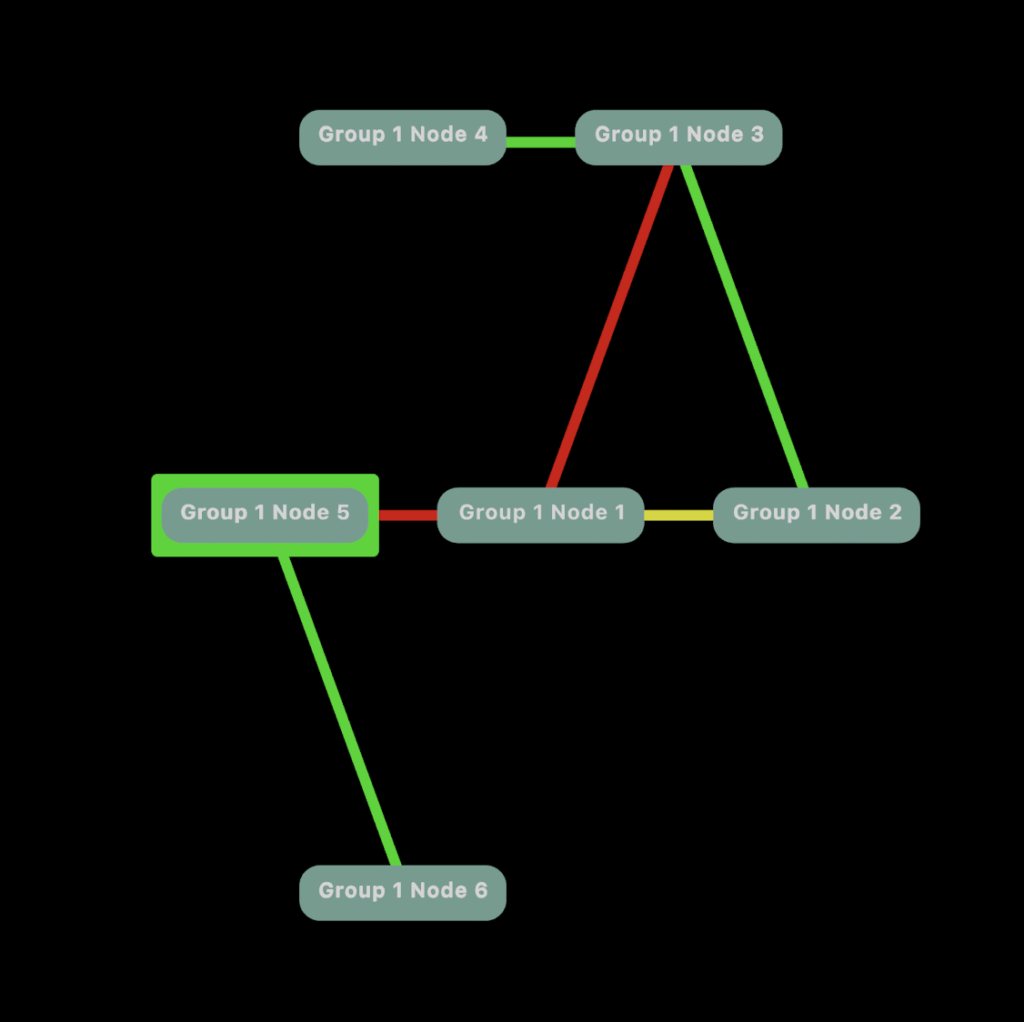
Now it this is starting to get fun.
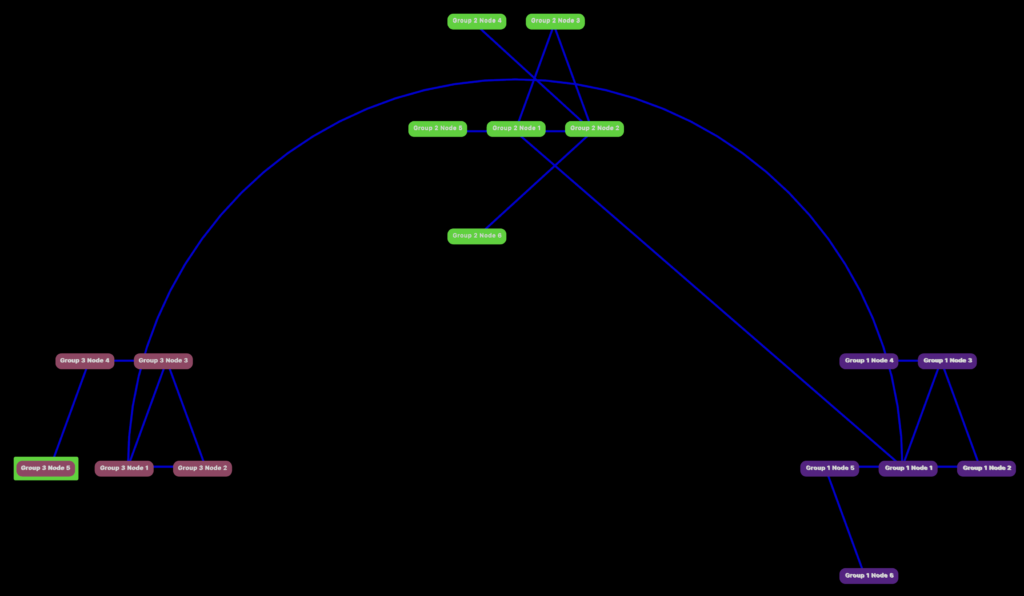
Clustering
What would really be helpful is if the nodes can be clustered together based on their connectedness and we get to the title of page. Spectral graph clustering is a technique by which you transform the graph into an xy plane where each node has x and y coordinates. With that KMeans can be applied to cluster the nodes. I would not have been able to do this without the online lectures of Daniel A. Spielman who made this process as simple as possible. After understanding the process the biggest challenge was implementing without Python.
The process is as follows
- Create an adjacency matrix
- Create a diagonal degree matrix
- Create a Laplacian matrix
- Find the Eigen values and Eigen vectors
- Filter the Eigen values most likely to provide good Eigen vectors. I found those close to 0 but not too close best.
- Create a matrix using the Eigen vectors corresponding to the first two Eigen values closest to 0 where the first vector values are used to populate the x axis and the second to populate the y axis for each node.
- Use KMeans to cluster the nodes
Appendix
In case you want to find Eigen values in Swift you might find this code of assistance. Import Accelerate and use the lapack function dsyev_
func eigenDecomposition(of matrix: [[Double]], clusterCount: Int) -> KMeans.FitResult? {
let lWork = 3 * matrix.count – 1
var nn = matrix.count
var an = matrix.flatMap { $0 }
var ldan = matrix.count
var wn = [Double](repeating: 0, count: matrix.count) // DOUBLE() gives a single value [Double]() an empty array
var workn = [Double](repeating: 0, count: lWork)
var lworkn = lWork
var infon = 0
dsyev_(“V”, “U”, &nn, &an, &ldan, &wn, &workn, &lworkn, &infon)
var eigenValues = wn
let eigenVectorMatrix = stride(from: 0, to: matrix.count * matrix.count, by: matrix.count).map {
Array(an[$0..<min($0 + matrix.count, matrix.count * matrix.count)])
}
var roundedEigenVectorValueMatrix = eigenVectorMatrix.map { $0.map { Double(String(format: “%.2f”, $0))! } }