
The MNIST dataset contains images of handwritten digits from 0 to 9. Using the machine learning K-Means algorithm to cluster the MNIST dataset achieves poor results. This experiment seeks to improve and measure the accuracy by using an autoencoder to massage the input data prior to K-Means. To measure the results a purity score will be generated and a confusion matrix will display the distribution of the clusters.
The notebook is available on GitHub https://github.com/MichaelSchlachter/clustering/blob/master/mnist_encoder_kmeans.ipynb
Generate a K-Means Baseline
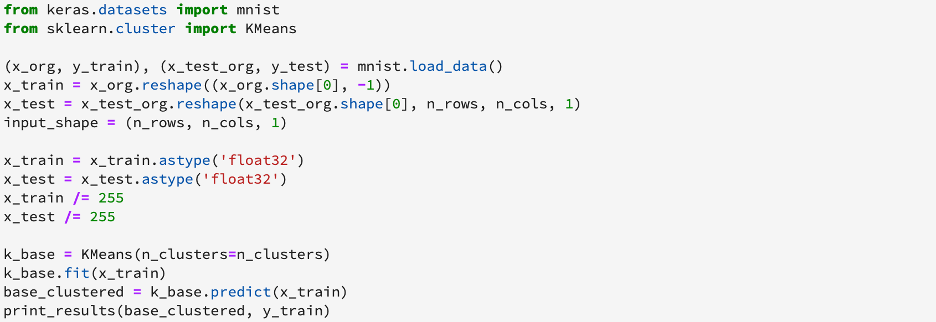
Show Baseline Results
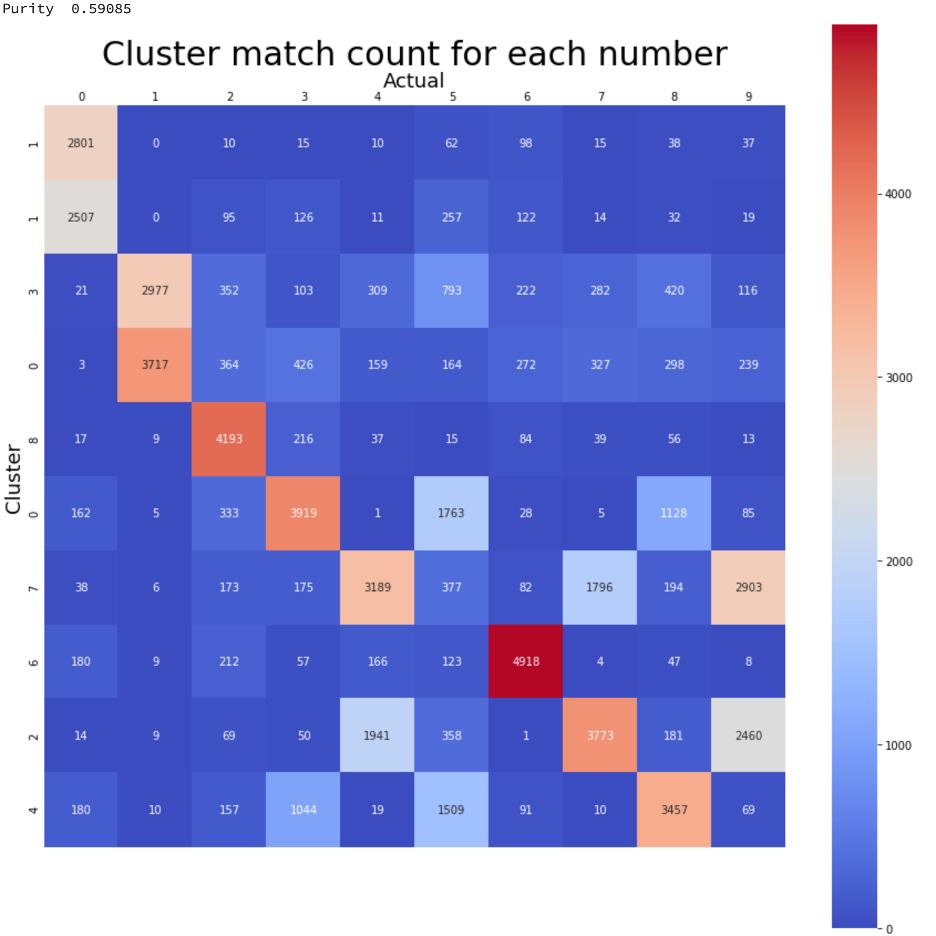
The baseline sorted matrix shows that only the cluster mapping to 0 was correctly matched most frequently. These results show that using K-Means on the MNIST dataset will not work well.
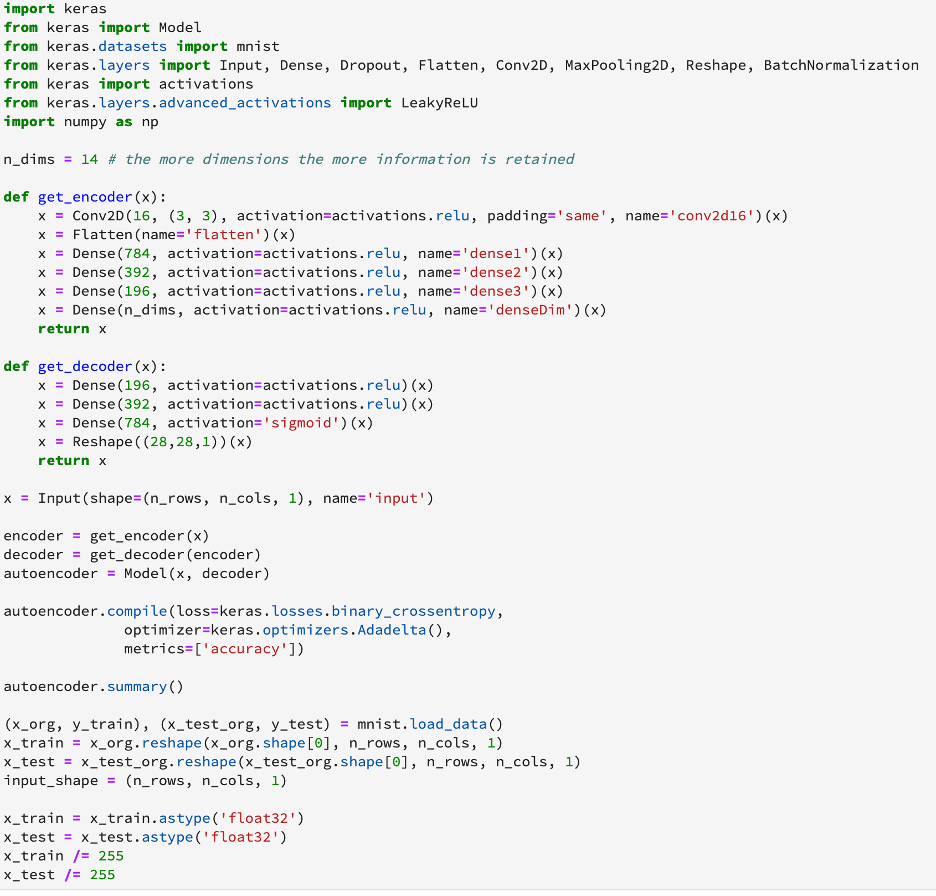
Create Autoencoder
The autoencoder will use the Keras machine learning interface to compress an image and then reconstruct it. The autoencoder will consist of encoder layers which will reduce the image to a specified number of data elements, and decoder layers which will predict the original image data matrix. Once the autoencoder is trained a model will be created using the encoding layers and the weights saved from the autoencoder. This encoder model will then be used to transform the image data prior to K-Means clustering.
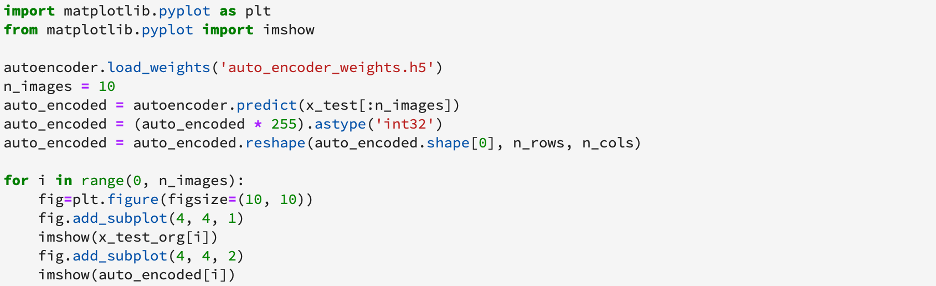
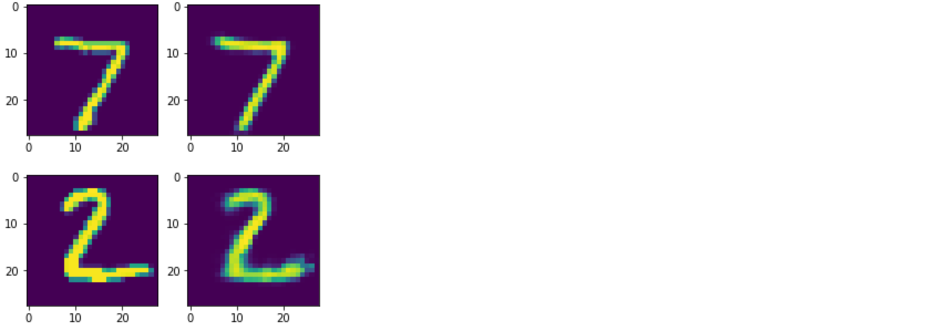
View Reconstructed Images to Confirm Auto Encoder is Working
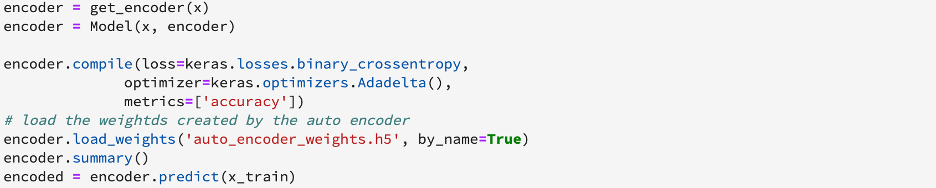
Create Encoder
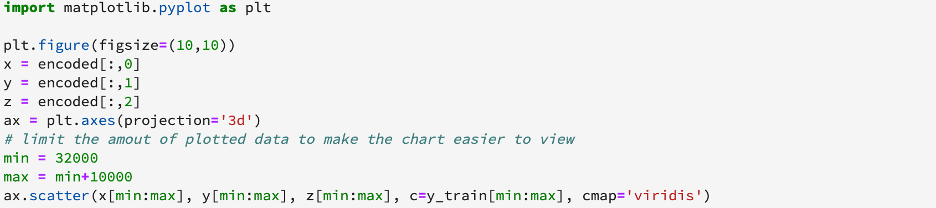
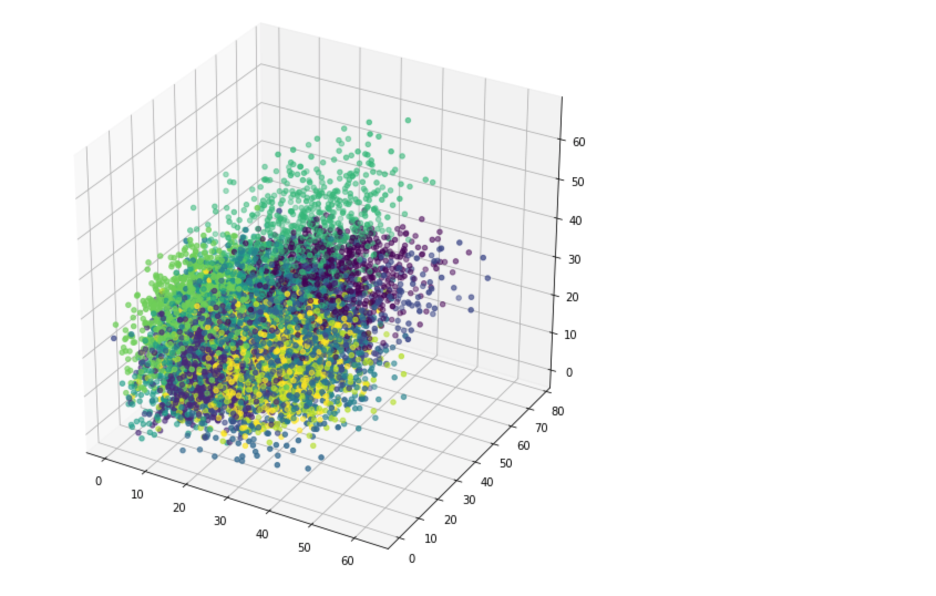
Visualize Encoded Images
In this example n_dims=10 and only the first 3 dimensions are visualized. Visualization can be more helpful when n_dims=2 or 3.
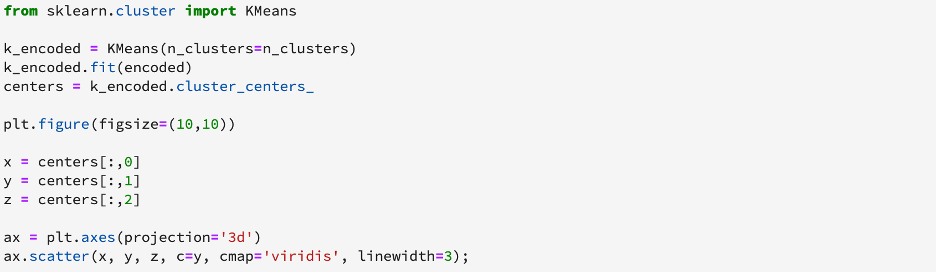
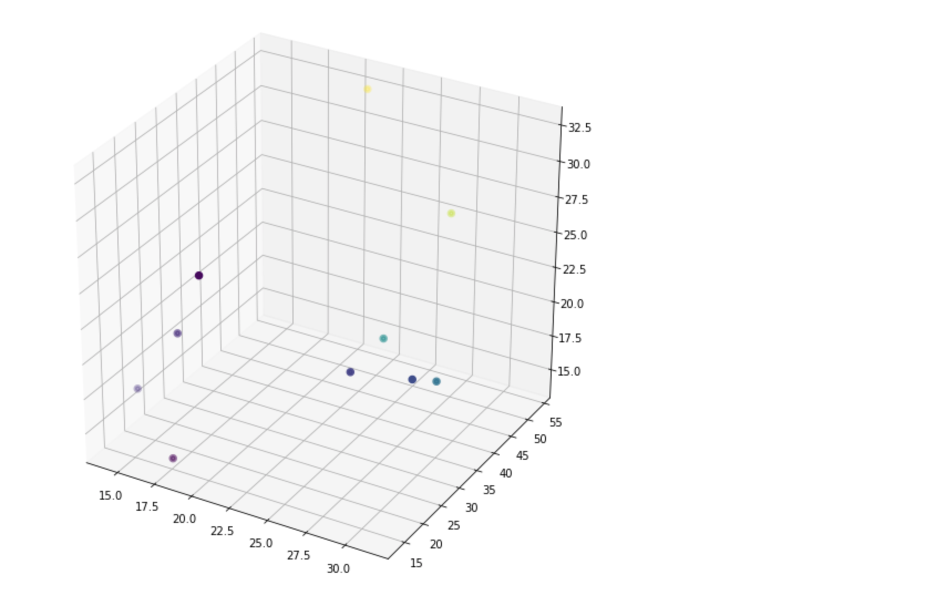
Train K-Means with Encoded Images
Use the encoded data to train K-Means and visualize the centers of each cluster. Again only the first 3 dimensions are being used for visualization and visualization would be most useful when n_dims=2 or 3.
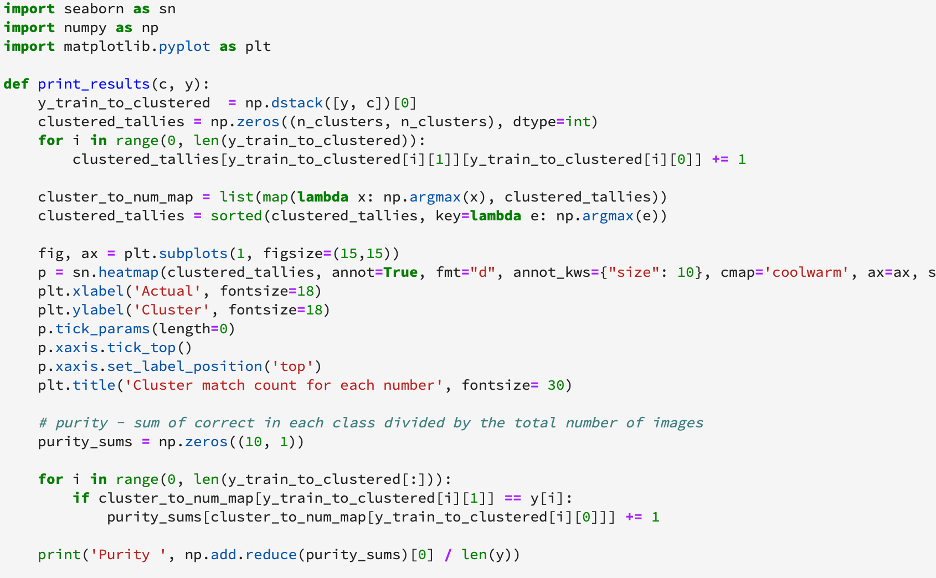
Create a Purity Score and Visualize the Results
The purity score and visualization will help ascertain the improvement of clustering.

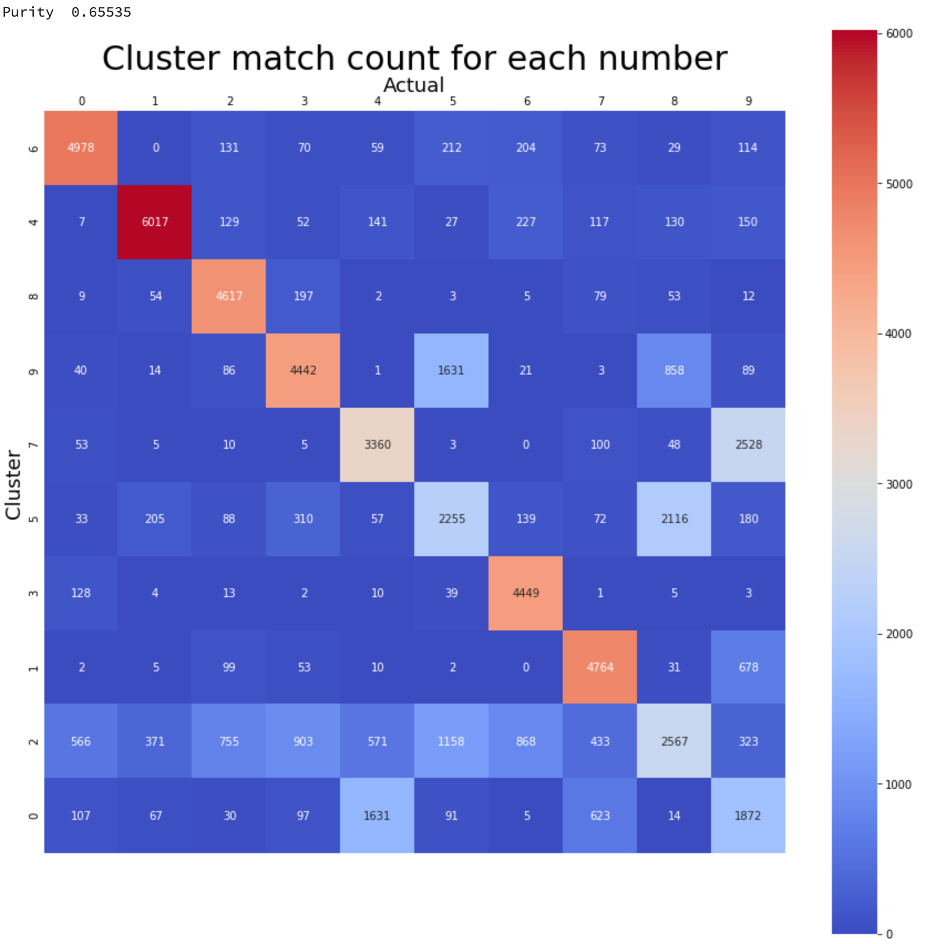
Conclusion
By using a deep learning convolutional and dense network the purity score increased from about 0.59 to about 0.66. The sorted confusion matrix shows that the most common occurrences within a cluster can be used to map all classes to the MNIST training targets with using encoding where when not using encoding only one class was able to be identified.